This page was produced as an assignment for Genetics 564, an undergraduate capstone course at The University of Wisconsin - Madison.
What is the transcriptome?
We learned in the central dogma of biology that the genome is composed of four nucleotides (G, C, T, and A), which are transcribed into RNA. The transcriptome is the collection of gene readouts for an organism [1]. Transcription of certain genes varies highly based on tissue type, stage of life, and even environmental conditions. For example, the proteins expressed in your brain are very different from the proteins in the lining of your stomach. By analyzing the wide range of RNA in a cell researchers can determine what is transcribed where in an organism [1]
Using transcriptome databases
Transcriptome databases are a record of what genes are present in different tissue types across a wide range of organisms. Gene databases are particularly useful for investigating the role of a a particular gene in question. For example, when cells exhibit exhibit tumerous growth trascriptomic markers indicate a continuous record of cell response pathways and mechanisms [2]. This information can be used to determine the genes involved in tumor suppressor genes, cell injury, or lytic pathways. In the case of Alzheimer's Disease, Amyloid Precursor Protein (APP) is expressed in many different tissues, with the most common isoform expressed in neuronal tissue [3].
The APP transcriptome
In this experiment, two different databases were used to gather information on the expression of APP, GEO Profiles and GEO datasets. GEO Profiles represent a database of experiments conducted across the country that record transcription levels of genes under various conditions (tissue types, model organism, chemical screen). Figure 1 illustrates that APP 4 production decreases in mouse T Cells under coronavirus infection. This implies that APP 4 is not involved in the immune response.
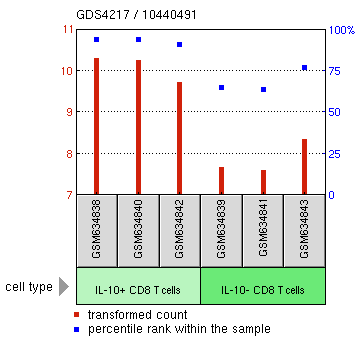
Figure 1. The transcription of APP 4 in the mouse T Cells responding to a coronavirus infection. The three wildtype replicates on the left show the expression of APP 4 under normal conditions (without infection) and the three experimental replicates on the right have lower APP expression.
Geo Datasets represent transcription levels with cluster analysis through a heat map. Columns (samples) are compared to rows (genes), which are rearranged by similar expression response patterns [4]. Green regions represent higher levels of transcription of a particular gene, whereas red regions represent lower levels of transcription.
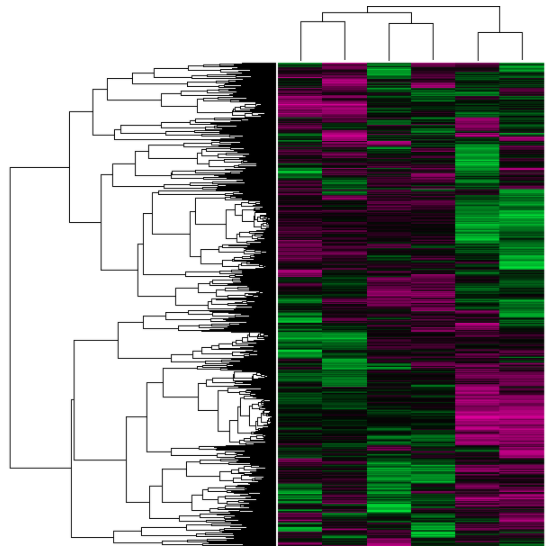
Figure 2. An analysis of neural cells induced to express APP, intracellular domain (AICD), or the combination of AICD and its transcription co-activator Fe65.
|
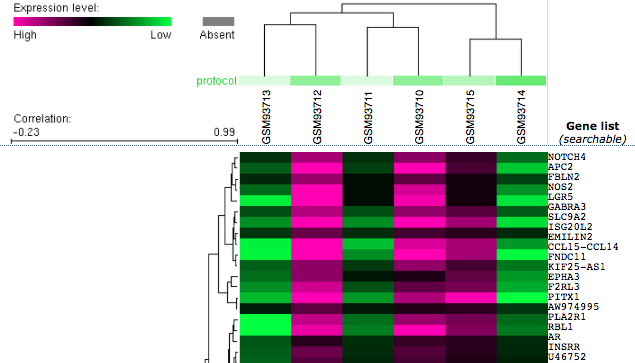
Figure 3. GEO Datasets allow you to zoom in on a region of the heat map to closely examine the chromosomal location of the gene in question and other closely located genes.
|
Conclusions
Further applications of transcriptomics can be used to investigate the role of APP in Alzheimer's Disease by using a chemical genetic screen. Analyzing the transcriptome of neuronal tissues treated with an experimental drug can be use to monitor APP expression levels, which would indicate the drug's effectiveness in reducing APP overexpression that is associated with Alzheimer's disease.
References
[1] Transcriptome Fact Sheet. National Human Genome Research Institute. Web. Accessed 08March17https://www.genome.gov/13014330/
[2] Szabo, D. 2014. Transcriptomic biomarkers in safety and risk assessment of chemicals. Biomarkers in Toxicology. 1033-1038.
[3] Matsui, T., et al. 2007. Expression of APP pathway mRNAs and proteins in Alzheimer's disease. Brain Research. 1161: 116-123.
[4] GEO Dataset Cluster Analysis. NCBI. Gene Expression Omnibus. Web. Accessed 09March17 https://www.ncbi.nlm.nih.gov/geo/info/cluster.html
